

Alabama Home Sales Up
03/02
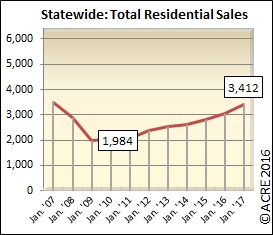
Alabama home sales ring in new year with 12 percent rise over 2016
Sales: Alabama home sales totaling 3,412 units during January were an increase of 12 percent from the same month a year ago. Alabama home sales totaled 3,050 units during January 2016. Two more resources to review: Quarterly Report and Annual Report.
Forecast: January sales were 8 percent or 256 units above the Alabama Center for Real Estate‘s (ACRE) monthly forecast. ACRE’s sales forecast for January projected 3,156 closed transactions, while the actual sales were 3,412 units.
Supply: The statewide housing inventory during January was 25,668 units, a decrease of 10 percent from January 2016 and 35 percent below the January peak in 2008 (39,228 units). There were 7.5 months of housing supply in January (6 months is considered equilibrium), which represents a favorable drop of 20 percent from January 2016 (9.3 months).
January inventory decreased from December by 1.3 percent. This direction is consistent with historical data that indicate January inventory on average (2011-15) decreases from December by 0.8 percent.
Seeking balance: The metro markets in Alabama representing 70 percent of all sales continued to trend toward greater seller bargaining power with 6.7 months of supply. Outside the metro markets, Alabama’s midsized markets are reporting 8 months of supply, while rural areas are reporting 11.2 months of supply. There have been significant improvements from inventory peaks experienced during the recession. The supply of quality inventory in the past has affected sales, according to some boots-on-the-ground professionals.
Industry perspective: “We expect housing to remain resilient and continue its recovery in 2017, with affordability standing out as the industry’s greatest obstacle, particularly for first-time homeowners,” said Fannie Mae Chief Economist Doug Duncan. “Demographic factors, however, are positive. Our research shows that older millennials have begun to buy homes and close the homeownership attainment gap with their predecessors.”
Click here to generate more graphs from the Alabama January Housing Report, including Total Sales, Average Sales Price, Days on the Market, Total Inventory and Months of Supply.
The Alabama Residential Monthly Report is developed in conjunction with the Alabama Association of Realtors and its local associations.